OE3D: Developing a Cartographic Interface
The development of a 2D and 3D cartographic interface is essential to the development of OE3D and has an important impact on the user interface. The most difficult task for the team was to find a legible way to display the enormous amount of data received from the various municipalities, counties and groups. The team needed to find a solution to display the different datasets that are useful to the various stakeholders, which can vary in size and scale.
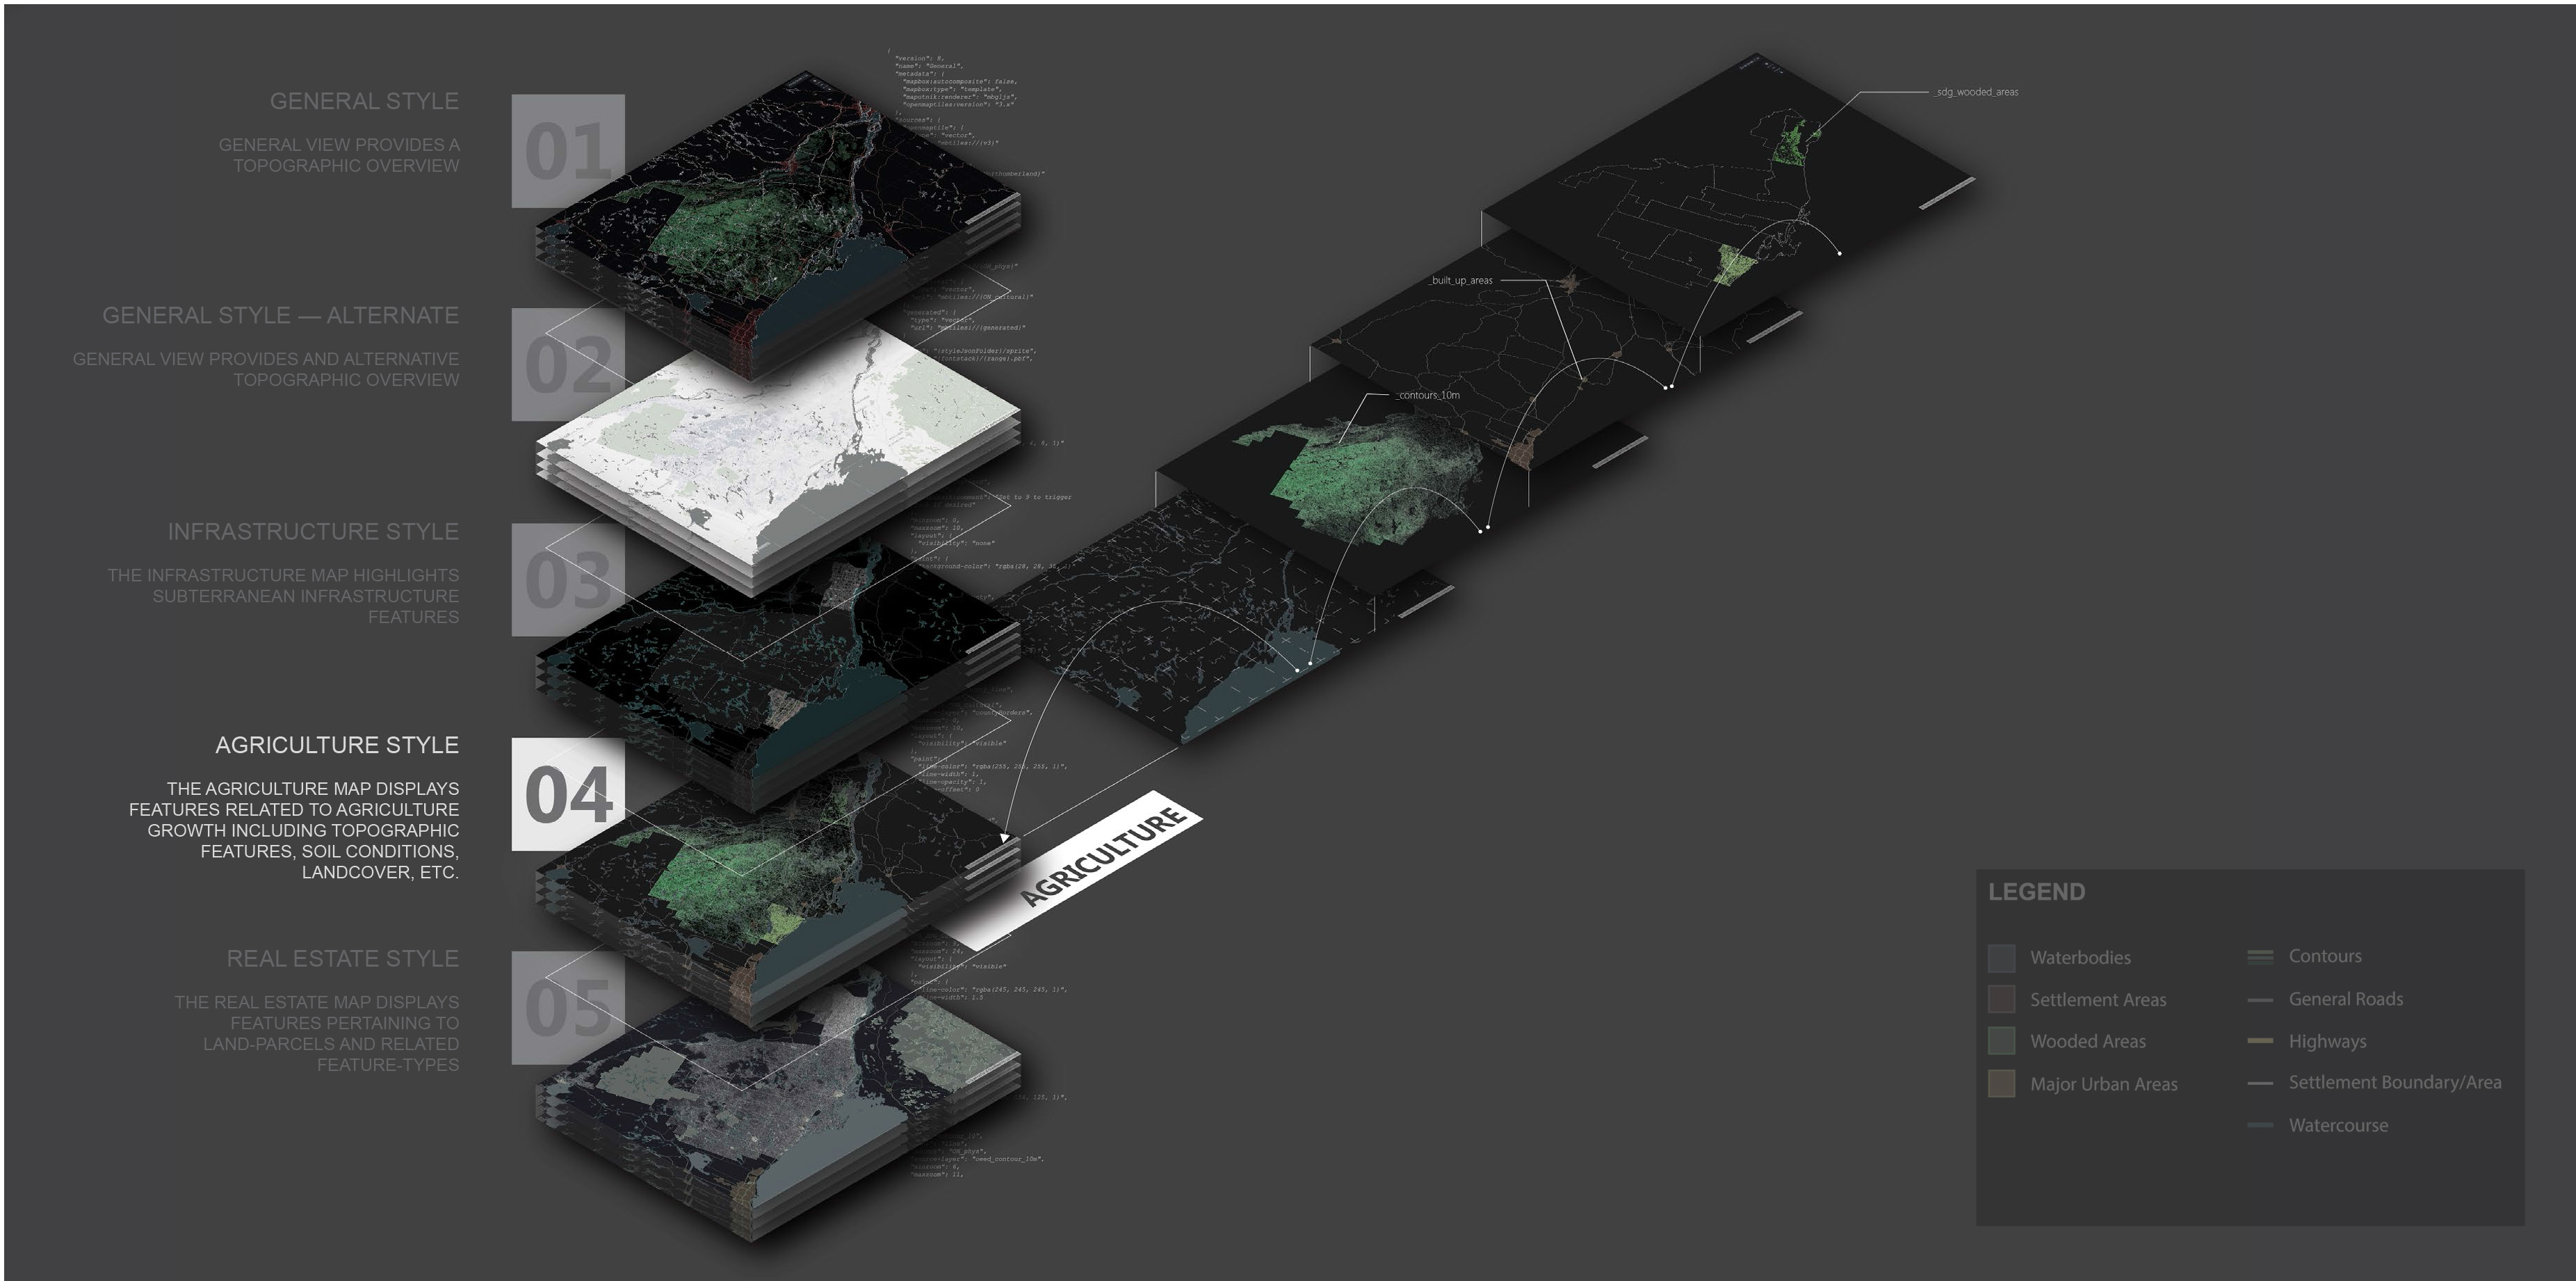
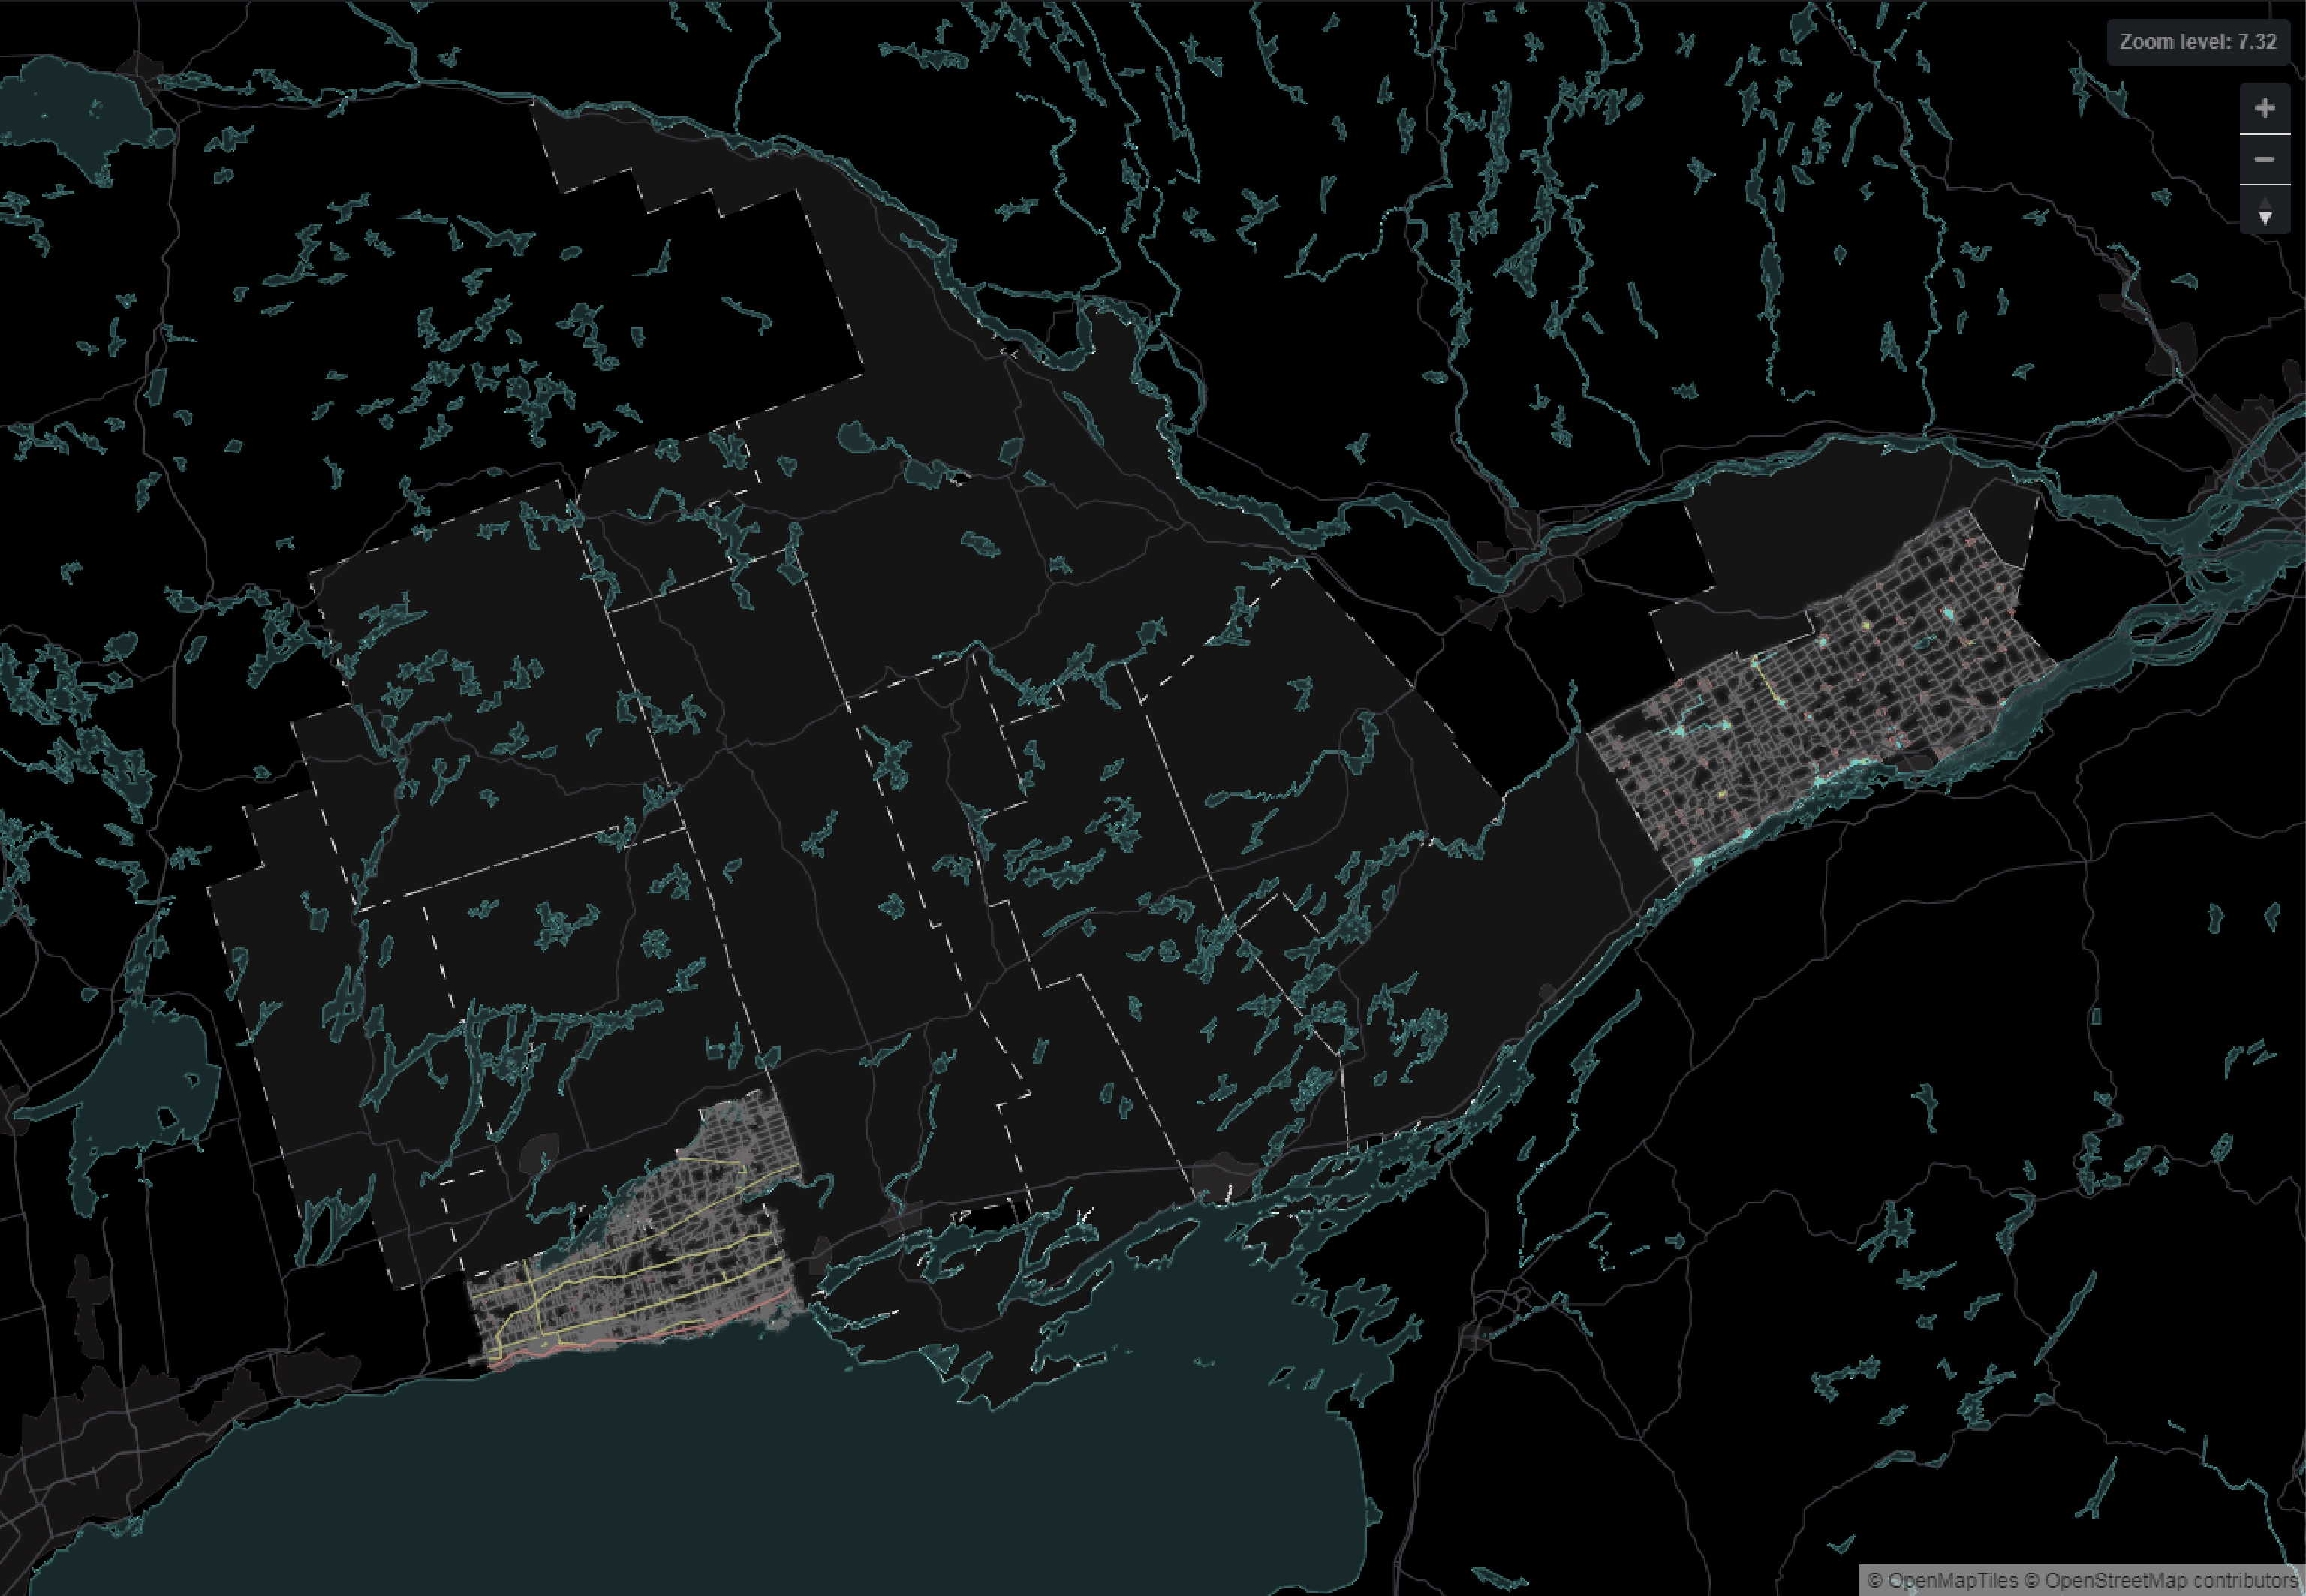
Rather than trying to display all of the information at once, the team opted for the creation of a set of five themed maps, which would be interchangeable in the app. Each map would be processed and styled using Maputnik’s style editor for web cartography to control the display of information based on the zoom extent. This method allowed for the classification of information in a legible way and contributed to make the app easy to navigate for users.
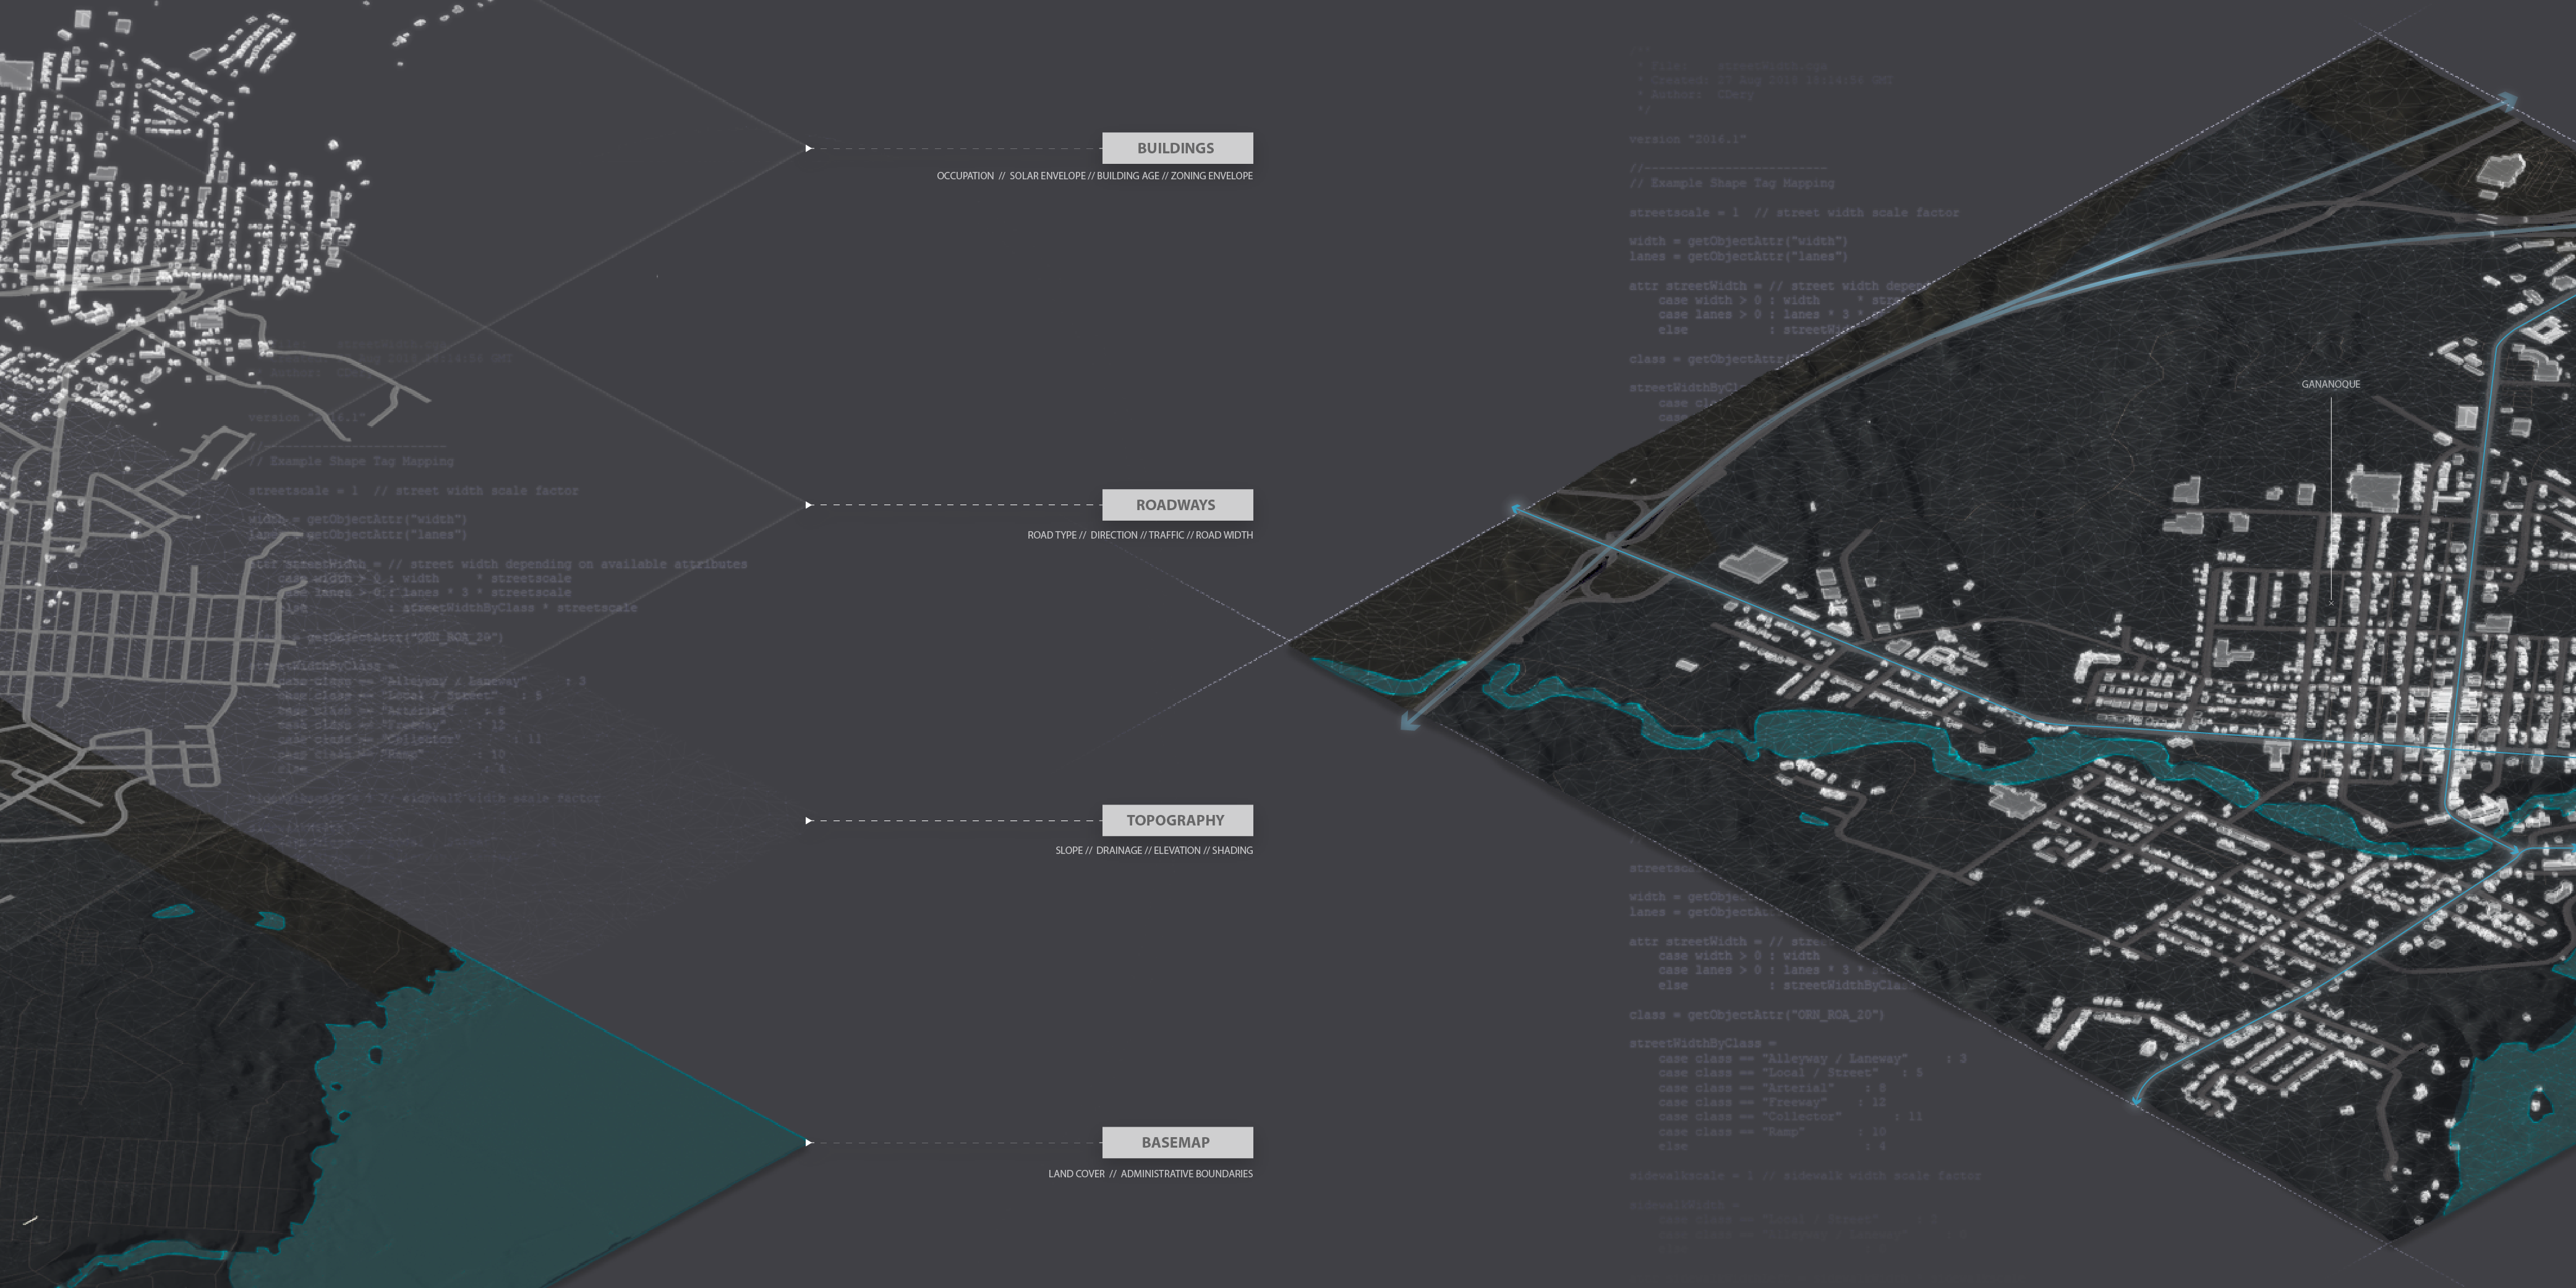
Throughout the development of OE3D, the team wrestled with creating a virtual model that would not only display data, but could also allow users to navigate through the space freely. In order to make the navigation through the model intuitive to users, the modelling team created a sense of scale by introducing base geometries for buildings and roads, as well as a more accurate topographical surface. This would provide users with an understanding of the spatial qualities of abstracted data.
To model the environment, the team relied heavily on the use of Esri’s ArcGIS and CityEngine tools for creating and processing georeferenced 3D geometry. The team worked from government-sourced LiDAR datasets, which were processed using LAS processing tools in ArcGIS. The use of Esri’s procedural tools allowed the team to rapidly generate geometries for large areas, which proved to be essential to the development of a model representing an area of over 50,000 square kilometers.
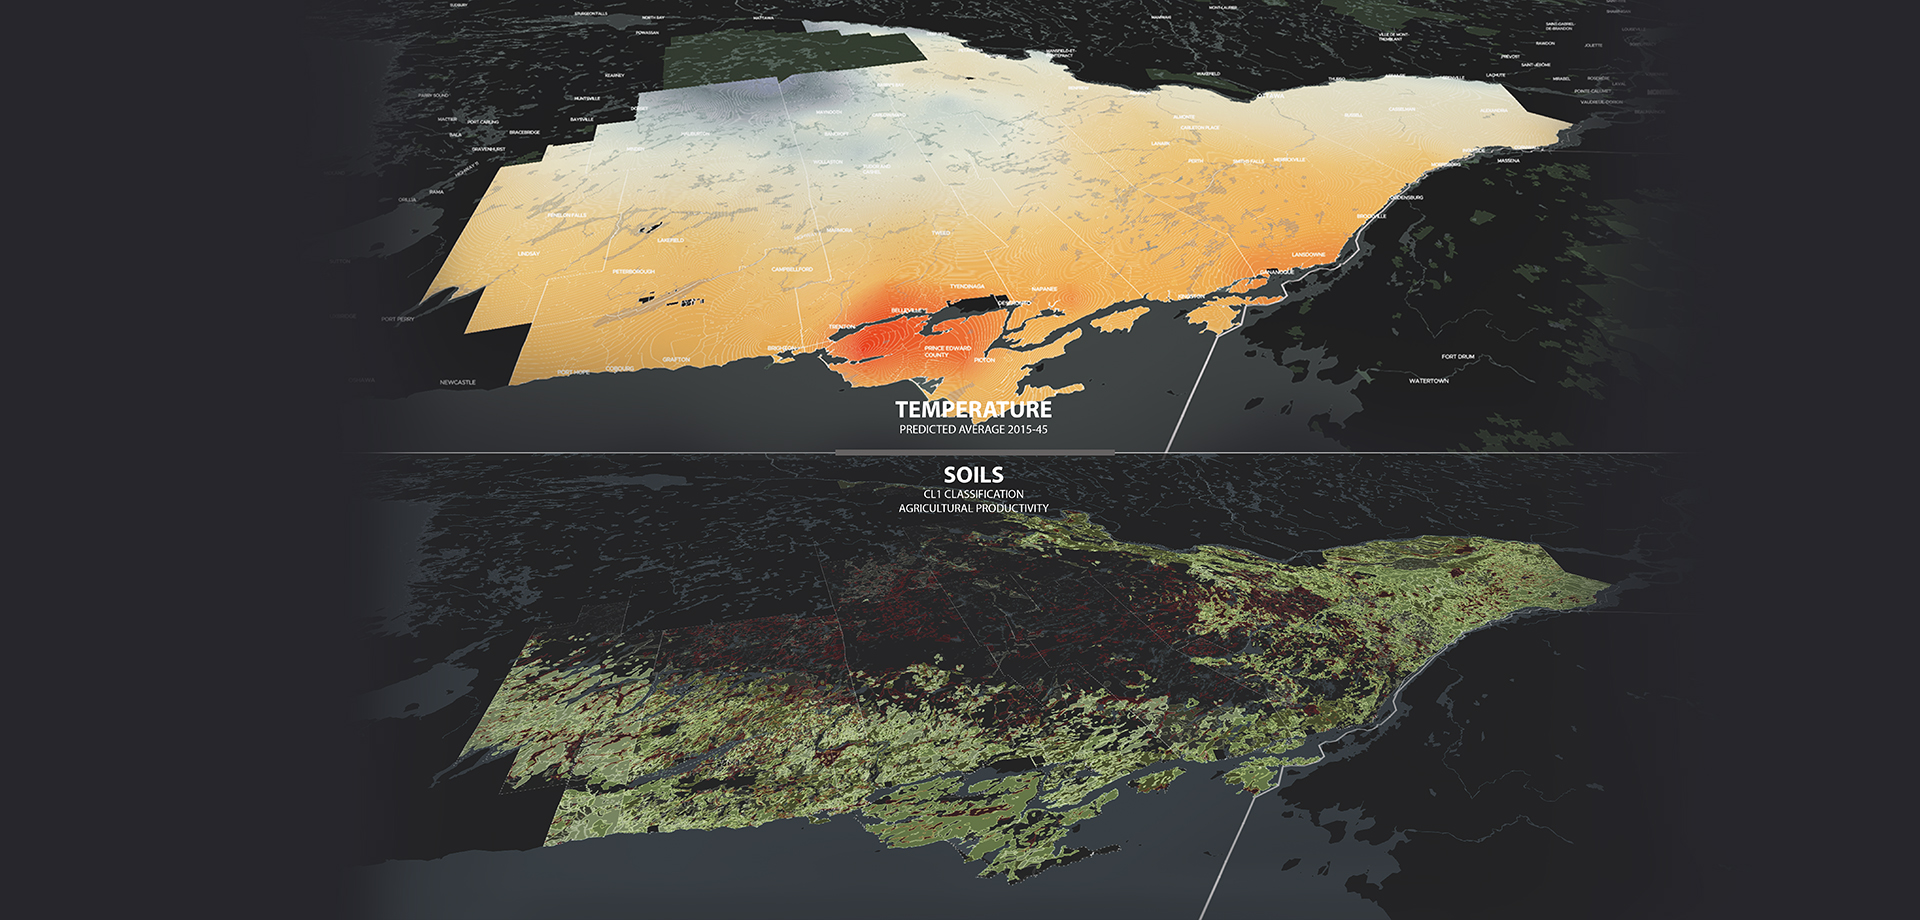
In addition to the mapping and modelling of the data received, the OE3D team produced a series of derivative map layers that provide additional information on Eastern Ontario. By adding these layers to the app, the team is hoping to provide a clearer picture of the invisible processes affecting Eastern Ontario, as well as an understanding of how these processes are likely to change over time.
Working with data from the Ministry of Natural Resources and with existing infrastructure information, the team created new layers including geophysical data, past and anticipated climate variations, road connectivity and services distribution. To generate these layers, the team relied heavily on Esri’s Geoprocessing tools, including Network Analysis and Interpolation.