
CIMS Core Faculty: Liam O'Brien
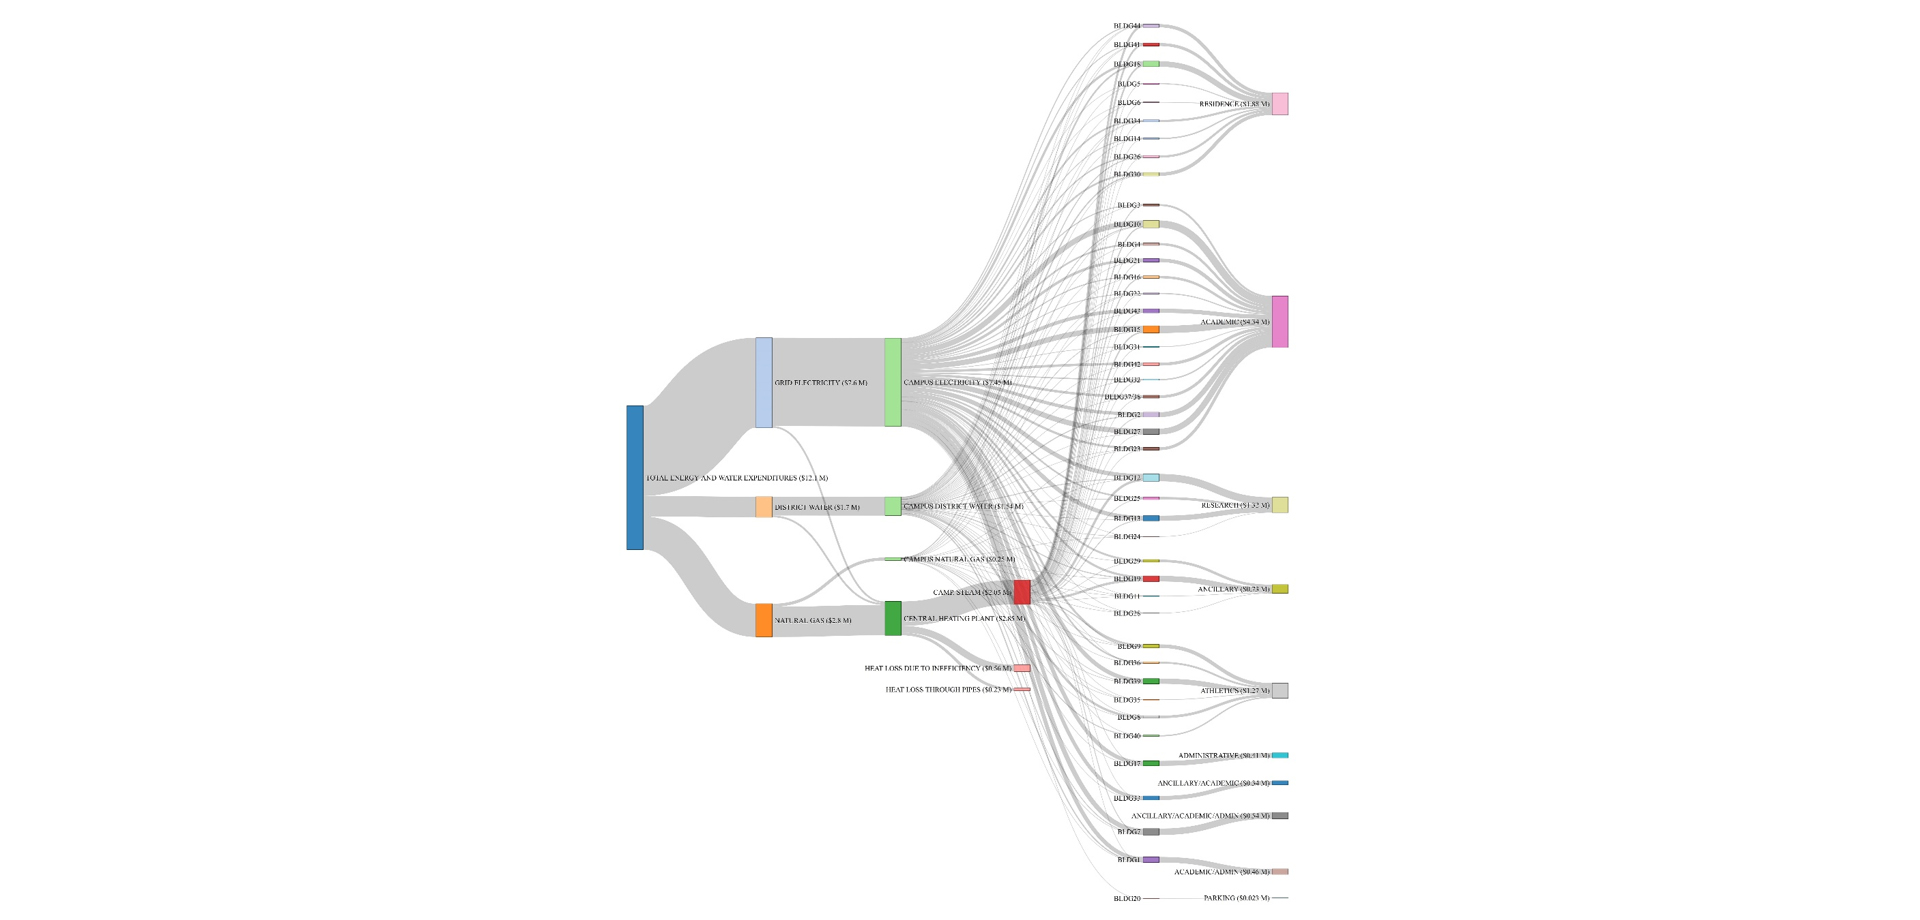
Shortly after being hired for Carleton’s new Architectural Conservation and Sustainability Engineering program in 2011, I got involved with CIMS. At that time, we partnered with Autodesk and Carleton’s Facilities Management and Planning to embark on a long-term project to use Carleton’s buildings as a living laboratory to conduct research on digital workflows, building operations, and data visualization. In the initial years of the Digital Campus project, some key milestones included developing detailed BIM models, novel data visualization methods, and fault detection methods. For example, we developed a means to apply Sankey diagrams to visualize energy flows through campus. We sought to understand how each Joule of energy transits through campus – from the time it is supplied to the time it is “used”. The approach was multi-scale in that Sankey diagrams were used to understand energy flows at the campus level down to the building system level (e.g., air-handling unit). Because many energy flows in buildings are not measured, part of this work has involved building calibrated energy models (e.g. Figure 3) to complement sensor and meter measurements. Working with Facilities Management and Planning, the Sankey diagrams were used directly to identify some faults in the Canal Building mechanical system. For example, we determined that the heat recovery wheel rarely operated; upon correction, it was saving an estimated $10,000 per year. Early examples of the project are shown in Figures 1-4.
 Figure 1: Sankey diagram showing total Carleton utility costs and how these are distributed across electricity, natural gas, and water, for each building on campus.
 Figure 2: Comparison of lobby of Canal Building and equivalent view from a rendered image.
 Figure 3: Example transition from detailed BIM models to an energy model. The energy model was consequently calibrated using measured energy data.
 Figure 4: Interactive 3D mapping tool to display the energy performance of Carleton’s buildings.
Recently, the Digital Campus project received fund from Autodesk and an NSERC Strategic Project Grant. This interdisciplinary collaboration between myself (Civil and Environmental Engineering), Computer and Systems Engineering (Gabriel Wainer), and Architecture (Stephen Fai) is again yielding innovations. Among the numerous outcomes to date, graduate students and a post-doctoral fellow are assessing the impact of the new Sprott School of Business building on the Architecture building (see Figure 5). The researchers have built a detailed parametric model of the new building so that they can better understand how it affects daylight and views (see Figure 6). Simultaneously, the researchers surveyed the occupants of the Architecture building to understand their perspective. Such mixed-methods approaches could be used in the early planning stages of future Carleton buildings and beyond.
 Figure 5: Rendering of new building with Architecture Building (left) and photo from inside studio (right). Courtesy of Vinu Subashini Rajus.
 Figure 6: Model used to assess views (left), simulated view quality without new building (centre), and simulated view quality with new building left). Courtesy of Vinu Subashini Rajus.
In closing, my collaboration with CIMS and colleagues from other units within the Faculty of Engineering and Design has opened up a wide variety of opportunities that would not have been otherwise possible. I believe the Digital Campus project has been a model for interdisciplinary research; the outcomes and training opportunities are much stronger as a result of the multiple viewpoints and skillsets across engineering and architecture. Moreover, the eagerness and leadership of FMP has enabled us to test novel concepts in the field, while giving students an unparalleled real-world training opportunity.